We will create a report using JARI
RPubs – Testing use of JARI – Just Another R Interface to generate Report
- Download JARI.zip at
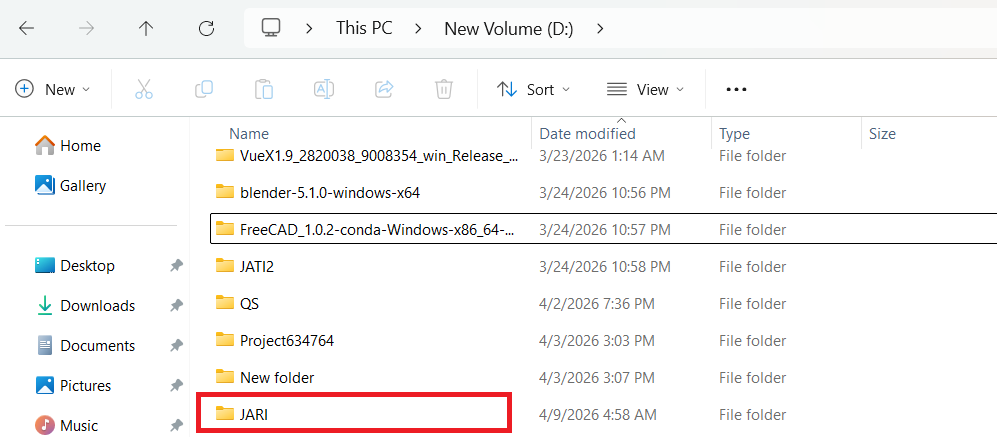
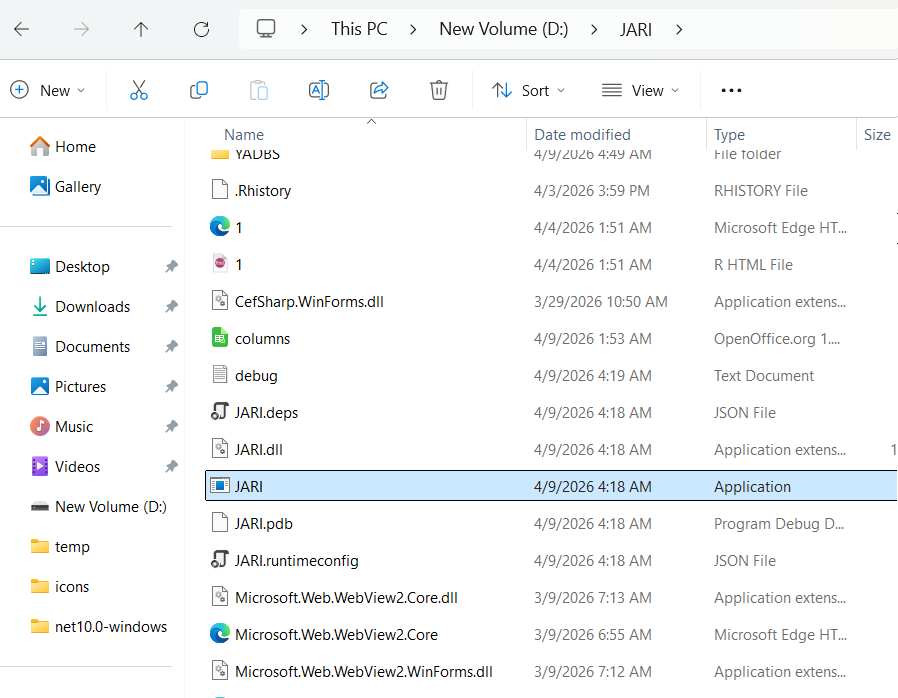
2. Extracted the files in D:/ drive. It is preferred to extract in D:/ drive or E:/ drive other than C:/ drive due to windows security. Start JARI.exe
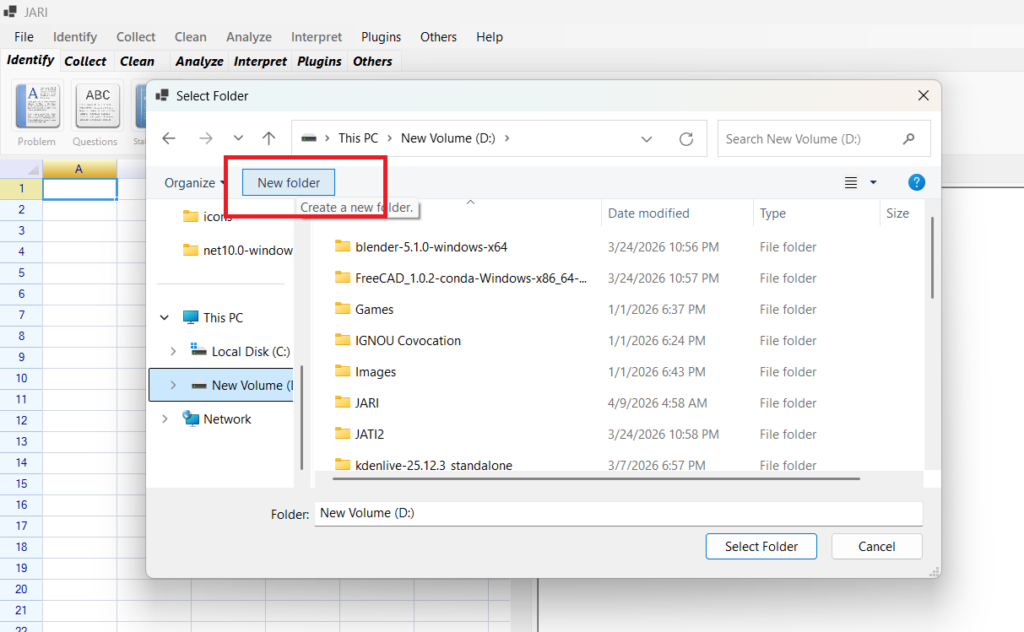
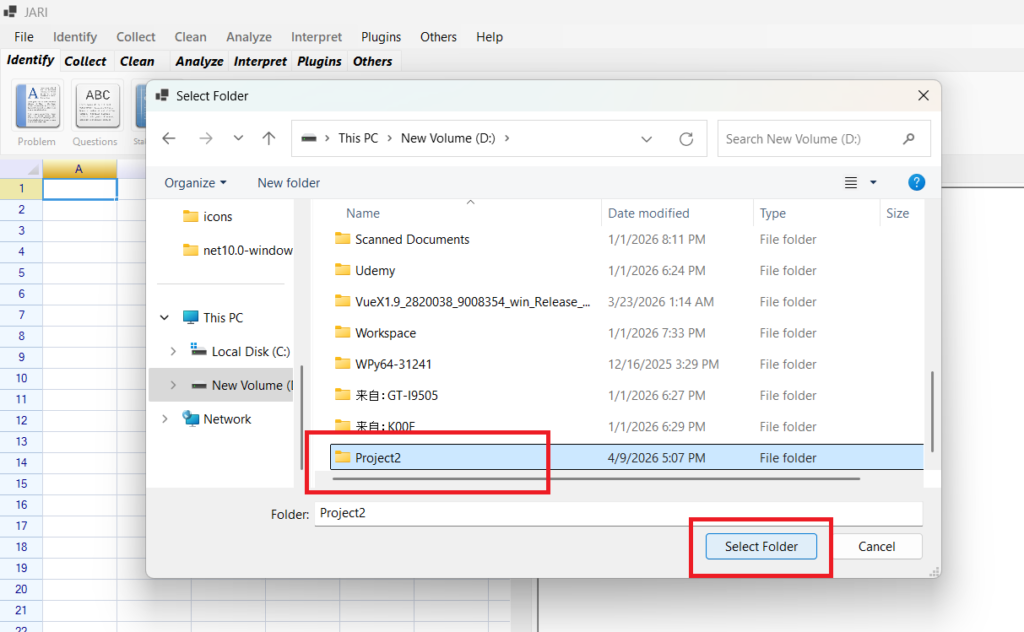
3. Create a New Project
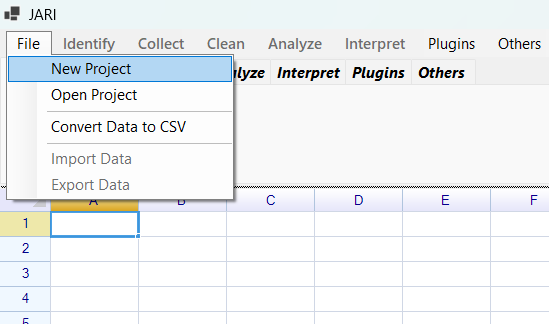
Click Create New Folder. It is preferred to save the project in D:/ also because of Windows security.
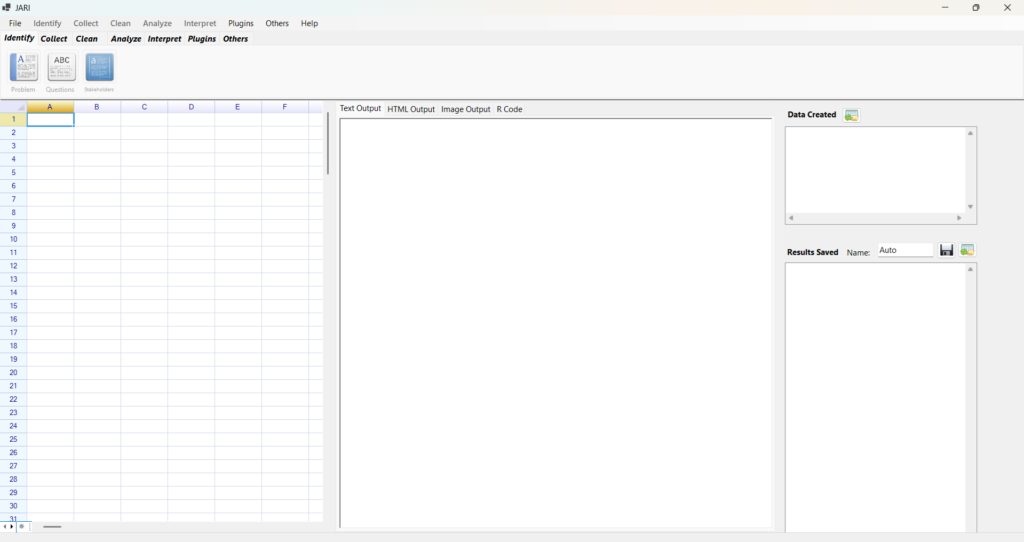
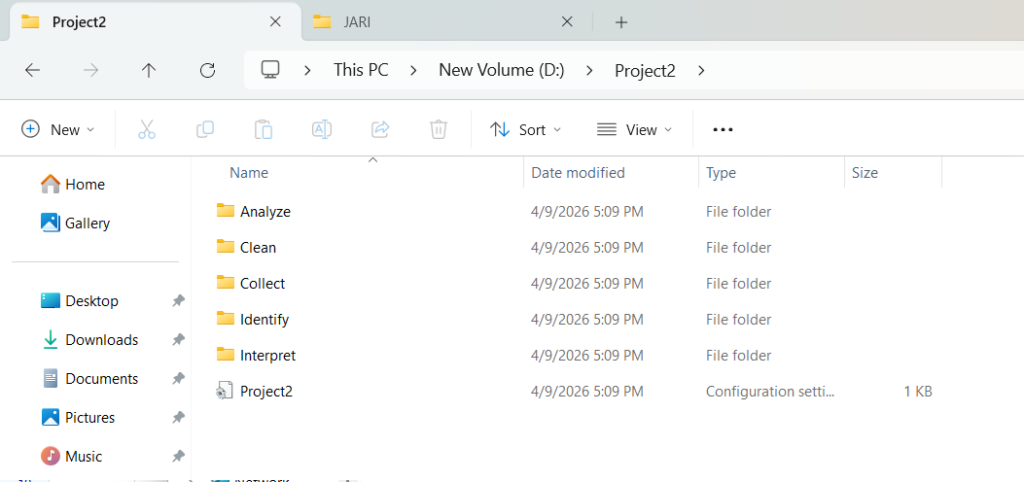
In project folder, you should see Identify folder, Collect Folder, Clean Folder, Analyze Folder, and Interpret Folder. JARI follows the Data Analysis Process. You should be spending time in these folders for the project.
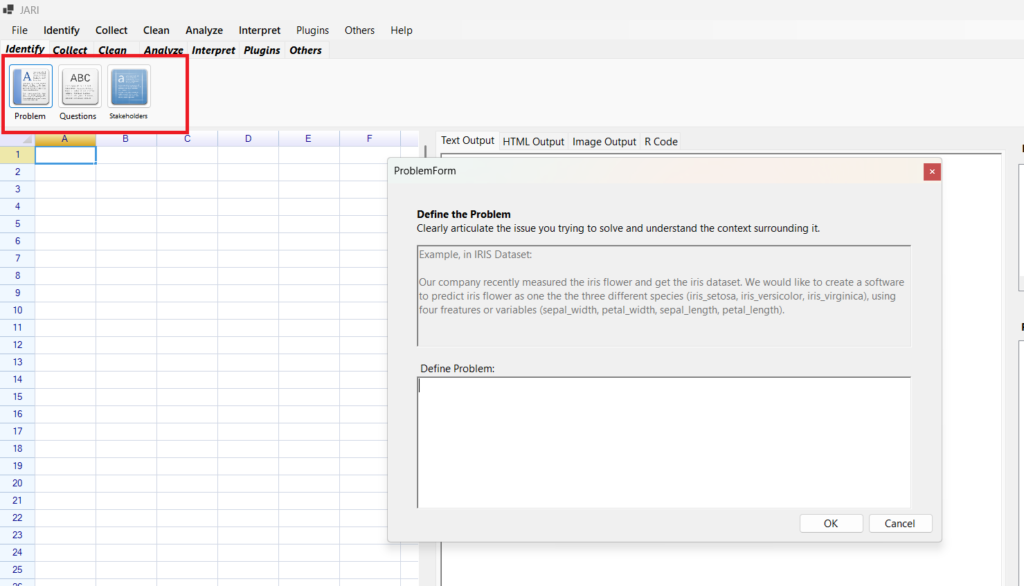
4. Identify
Click on Problem, or Questions or Stakeholders to write your Problems, SMART Questions and Stakeholders for your Data Analysis projects.
For here,
Problem Statement:
Our company recently measured the iris flower and get the iris dataset.We would like to get some plots and exploration on the dataset.
SMART Problems
- How are the variables correlated to each other?
- What is the distribution of each variable?
- How are the variables same to each other in mean or median?
Stakeholder Analysis
- Eric Goh Ming Hui holds Master of Technology and MBA. Eric Goh knows technical and business. Eric Goh is founder of EGMHAcademy.com, hence, he is more interested on performance and improvements.
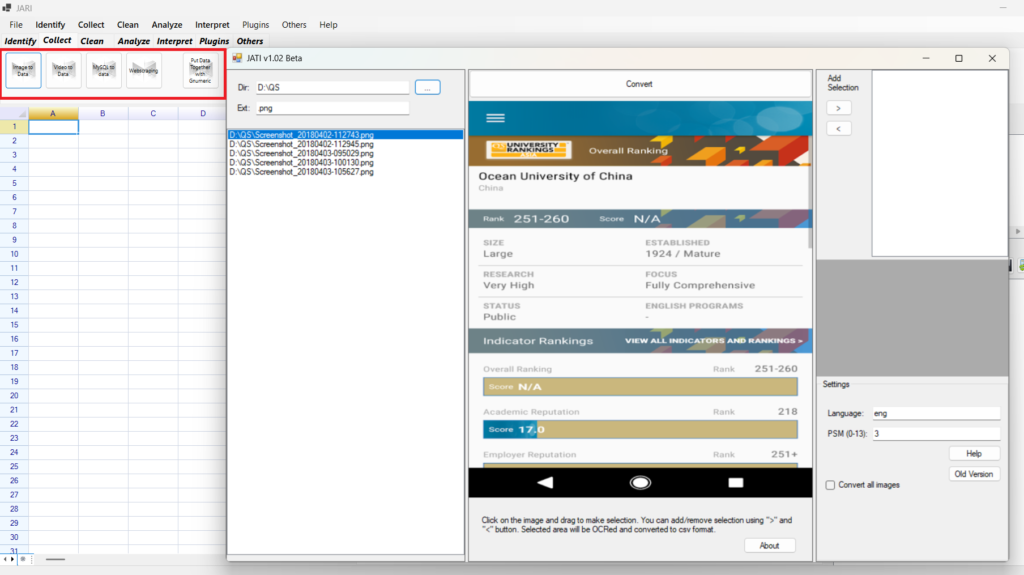
5. Collect
You can use the
- Image to Data: JATI software. The software OCR images to text.
- Video to Data: JAVT software. The software convert video to text. It uses Microsoft SAPI and CMU sphinx.
- MySQL to Data: YADBS Software/ The software convert MySQL to text.
- Webscraping: JAWS Software. The software get text from html.
- Put Data together with Gnumeric. Gnumeric is opensource software like Microosft Excel.
6. Clean
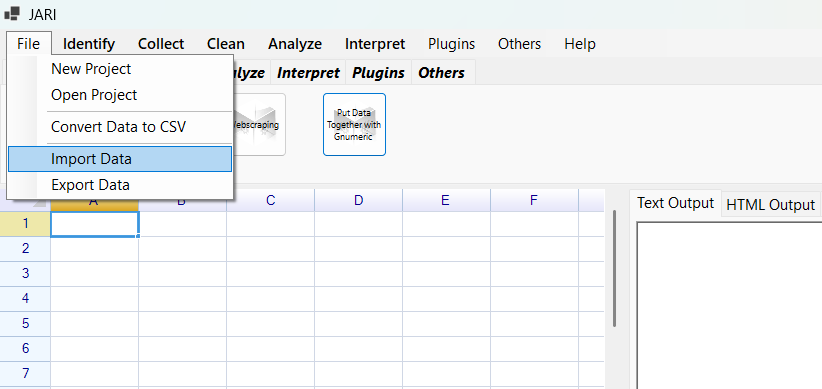
Assume we have collected the data by measuring iris flower, and put in iris dataset. Go File > Import Data
You can download the iris data from https://gist.github.com/netj/8836201
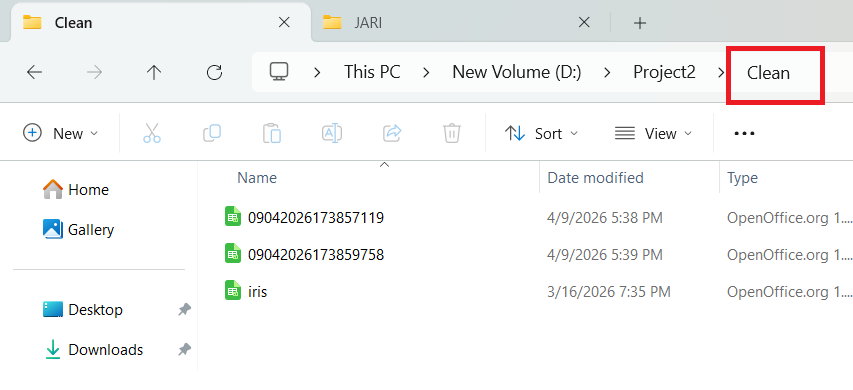
Put the iris.csv in D:/ also because of Windows security.
We can
- Duplicate Button: to remove Duplicates
- Missing Button: Remove missing values
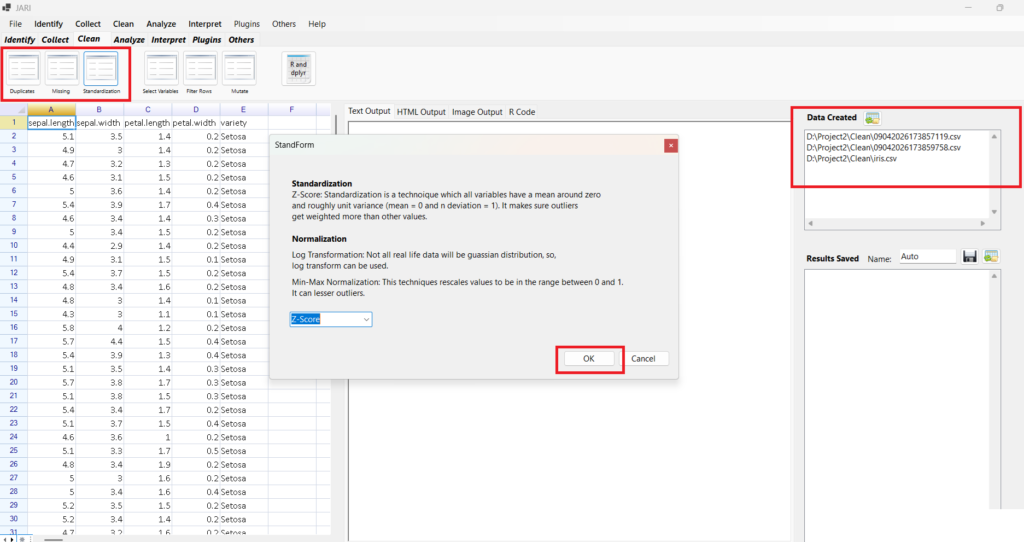
- Standardization Button: Standardization/Normalization
- Select Variables Button: Select variables for the dataset
- Filter Rows Button: Filter the rows for dataset
- Mutate Button: Create Variables
- R and dplyr Button: Use R and dplyr to Clean
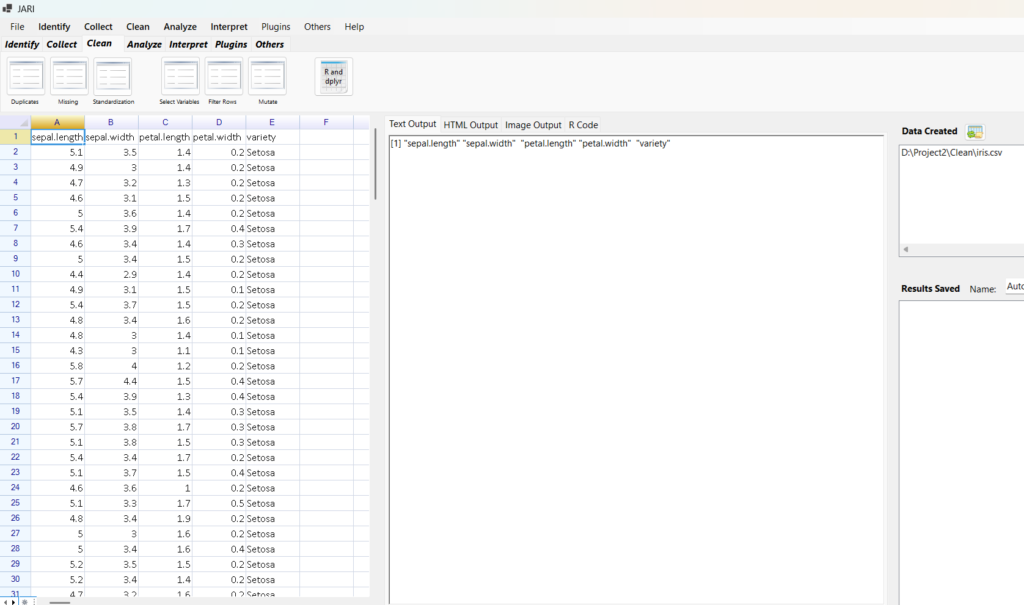
The Data Created on the right side shows the data created from removing missing values, removing duplicates, and the data are in the clean folder. Click on the data to change data.
7. Analyze
Click on View Variables, and we can see the Column names and Column Class. Column Names are the Variable Names.

SMART Problems
- How are the variables correlated to each other?
- What is the distribution of each variable?
- How are the variables same to each other in mean or median?
So, how are the variables correlated to each other?
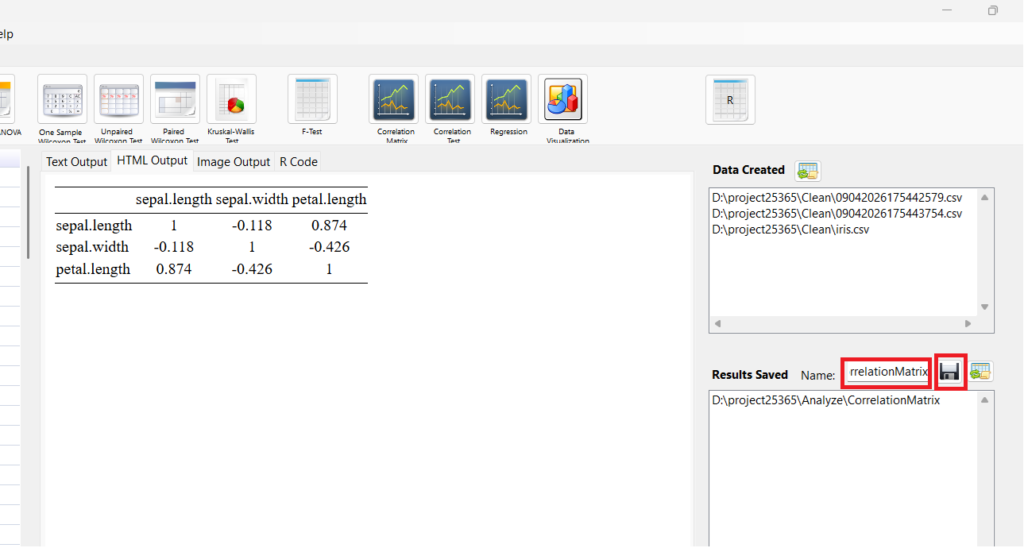
Click Correlation Matrix and select variables. Click OK.
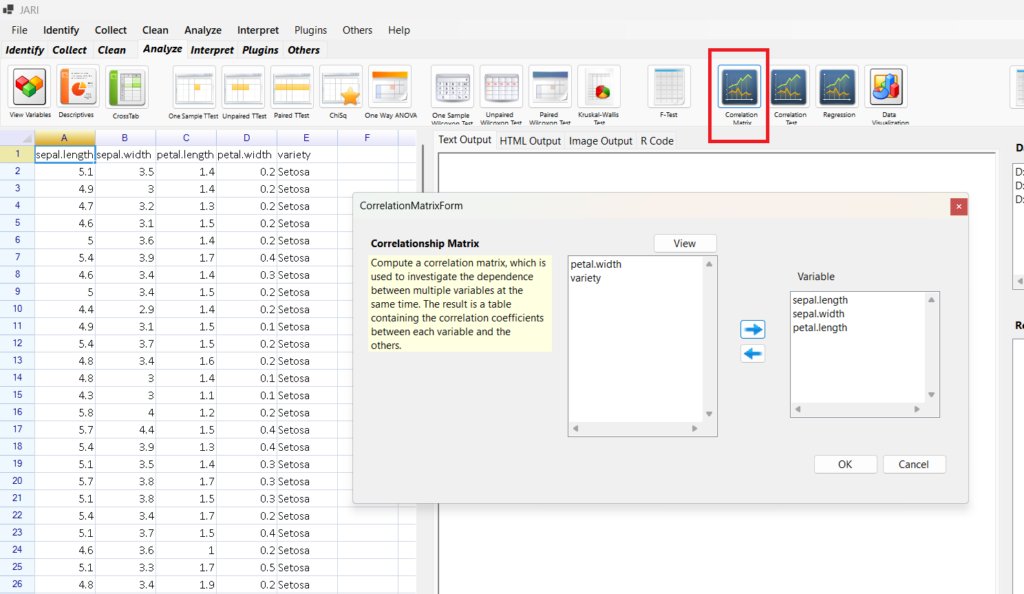
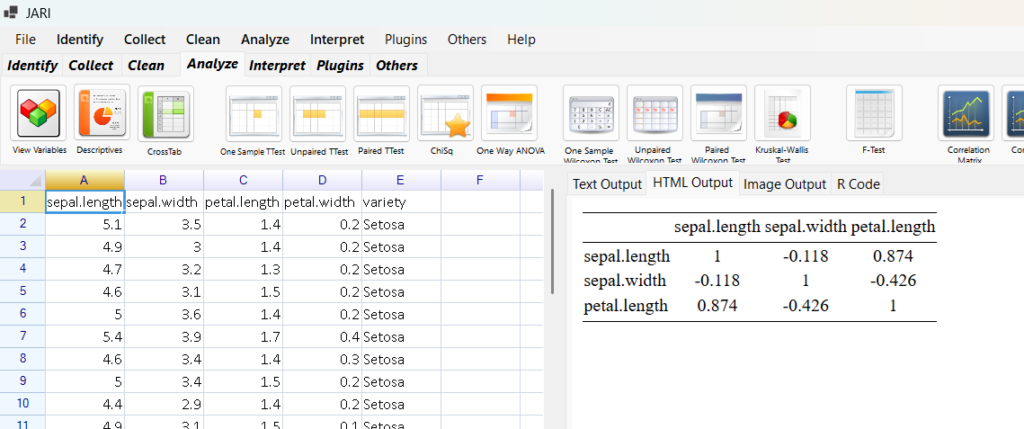
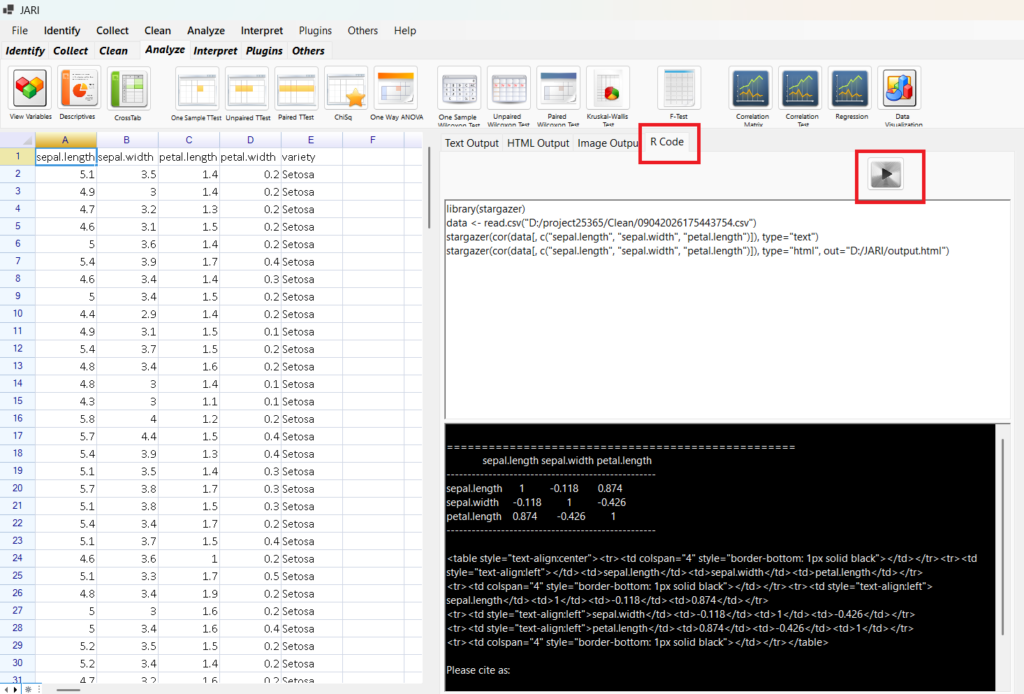
We only select three variables because if we select four variables, there will be errors because of stargazer library. We can however, click on the R Code to edit the R codes and error.
JARI generate the R Codes, it allows you to edit the R Codes.
At the right side, there is Results Saved. Name CorrelationMatrix (no spacing) and click save. We save the results.
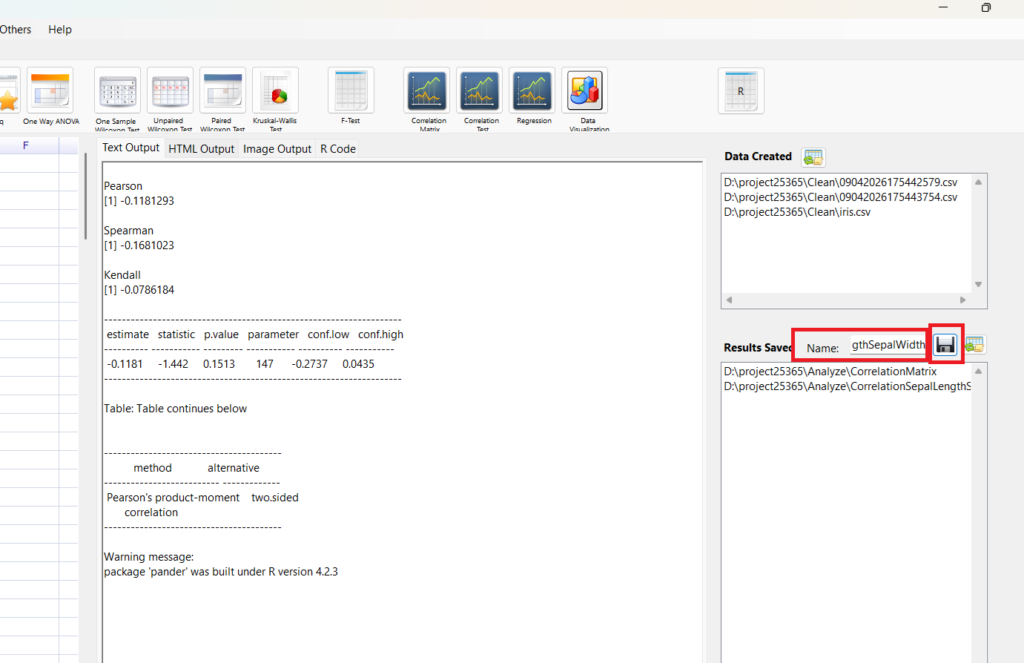
Click Correlation Test. Select Sepal Length and Sepal Width. Click Ok.
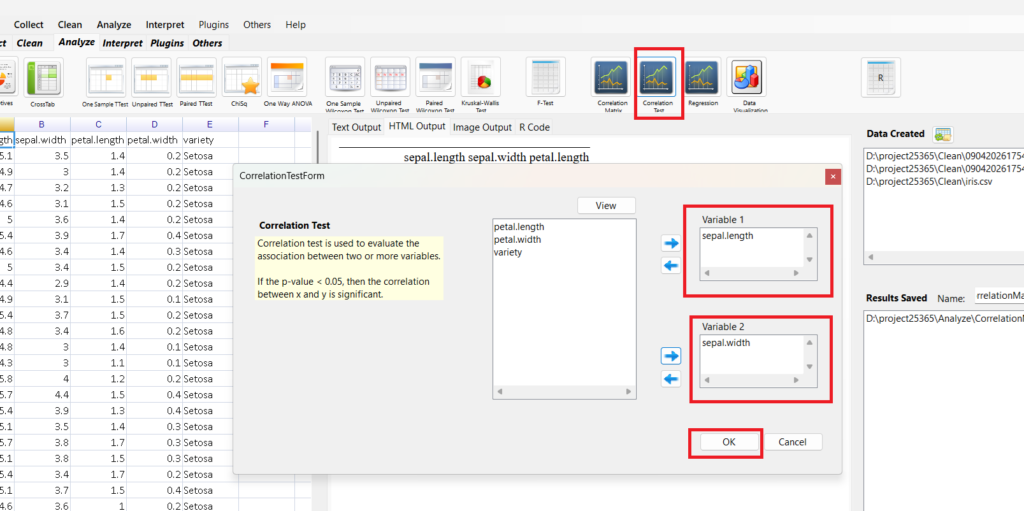
Save results. Name: CorrelationSepalLengthSepalWidth.
We can infer that the correlation is low.
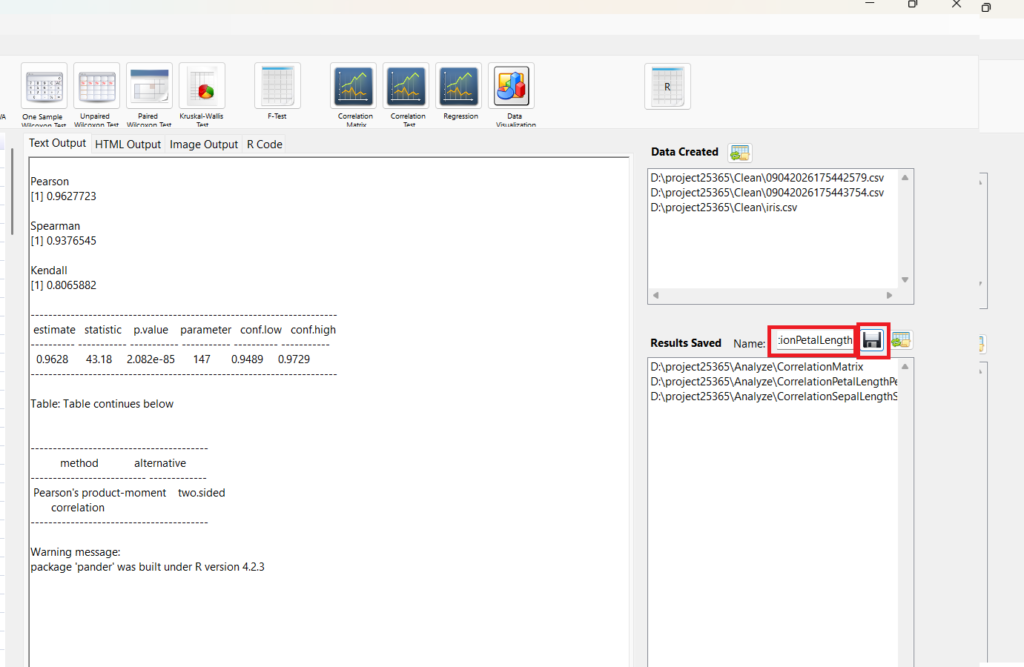
Do the same for Petal Width and Petal Length.
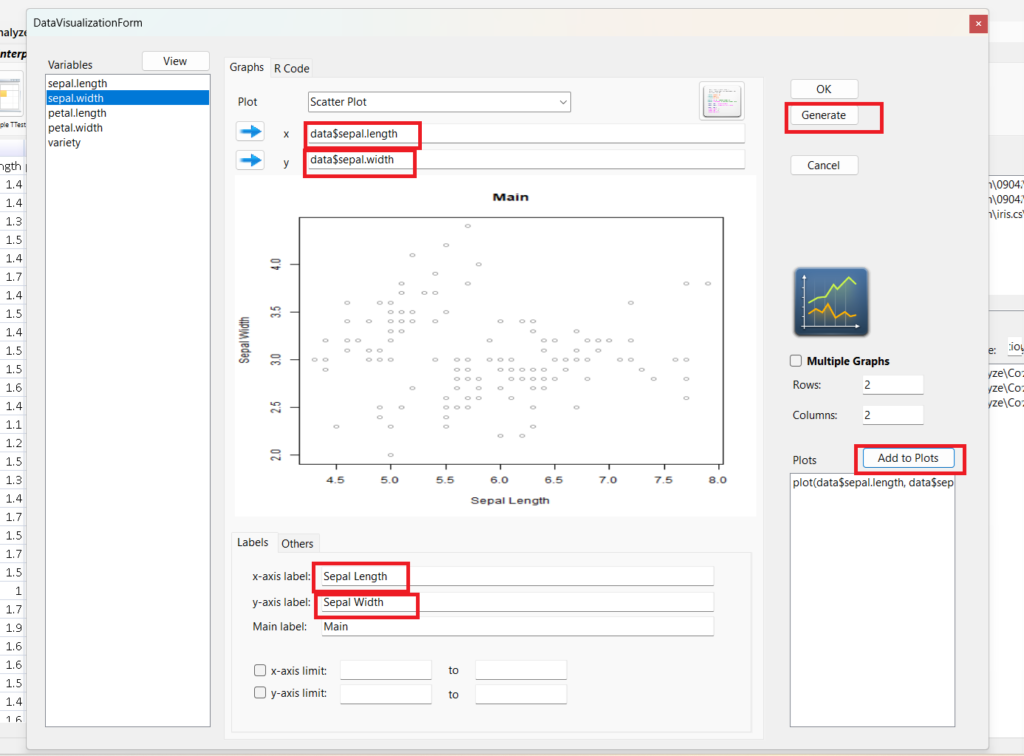
Plot a Scatterplot
Click Data Visualization
Edit the x, y, x-axis, y-axis
Click Generate
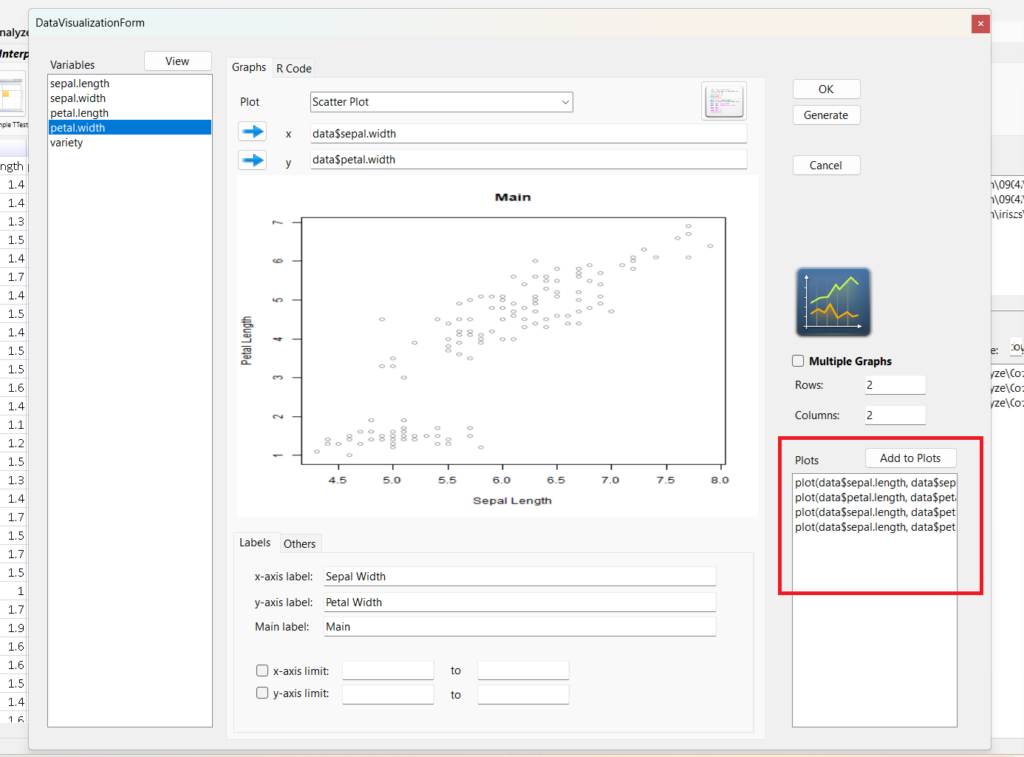
Click Add to Plots
Repeat that for
- Petal Length and Petal Width
- Sepal Length and Petal Length
- Sepal Width and Petal Width
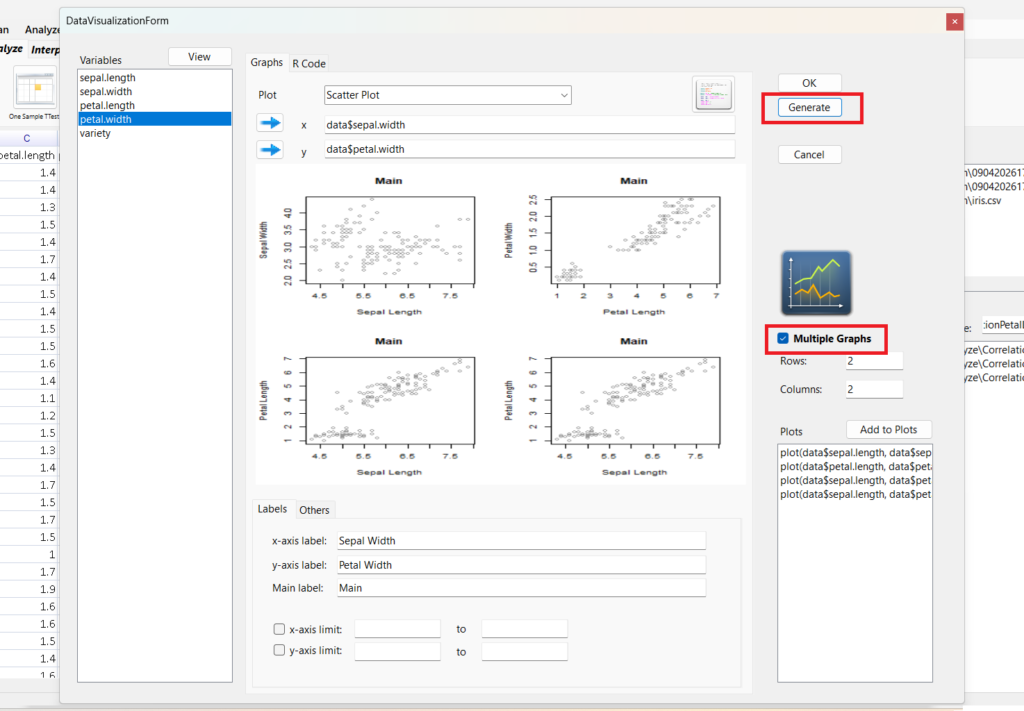
Click Multiple Graphs
Click Generate
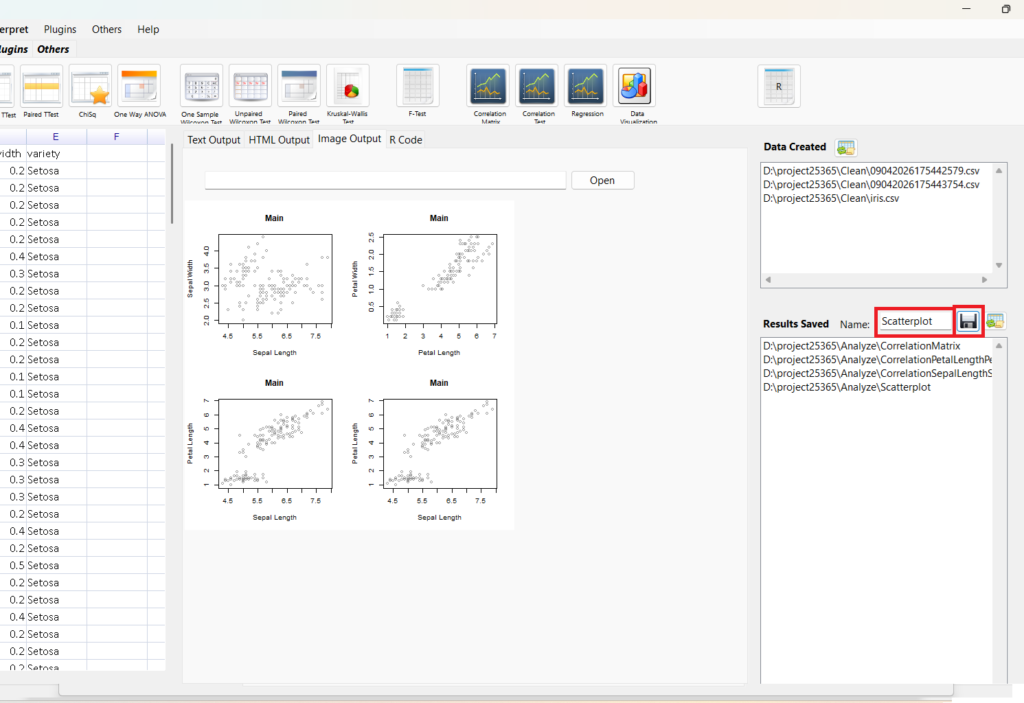
Click OK
Save results. Name CorrelationSepalLengthSepalWidth.
SMART Problems
- How are the variables correlated to each other?
- What is the distribution of each variable?
- How are the variables same to each other in mean or median?
So, what is the distribution of each variable?
Click descriptives
Sepal Length
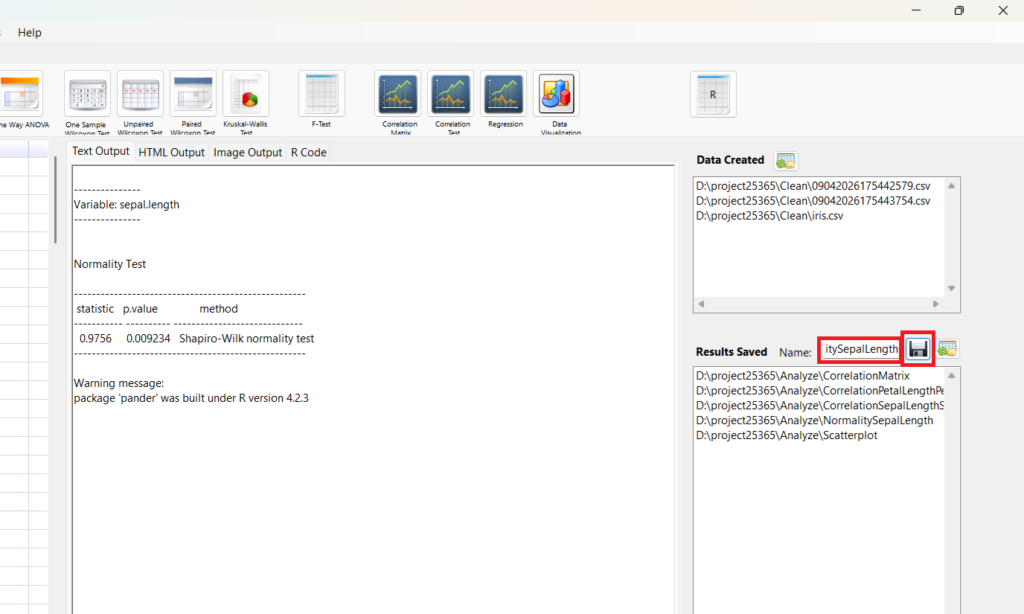
Click Normality Test
Click OK
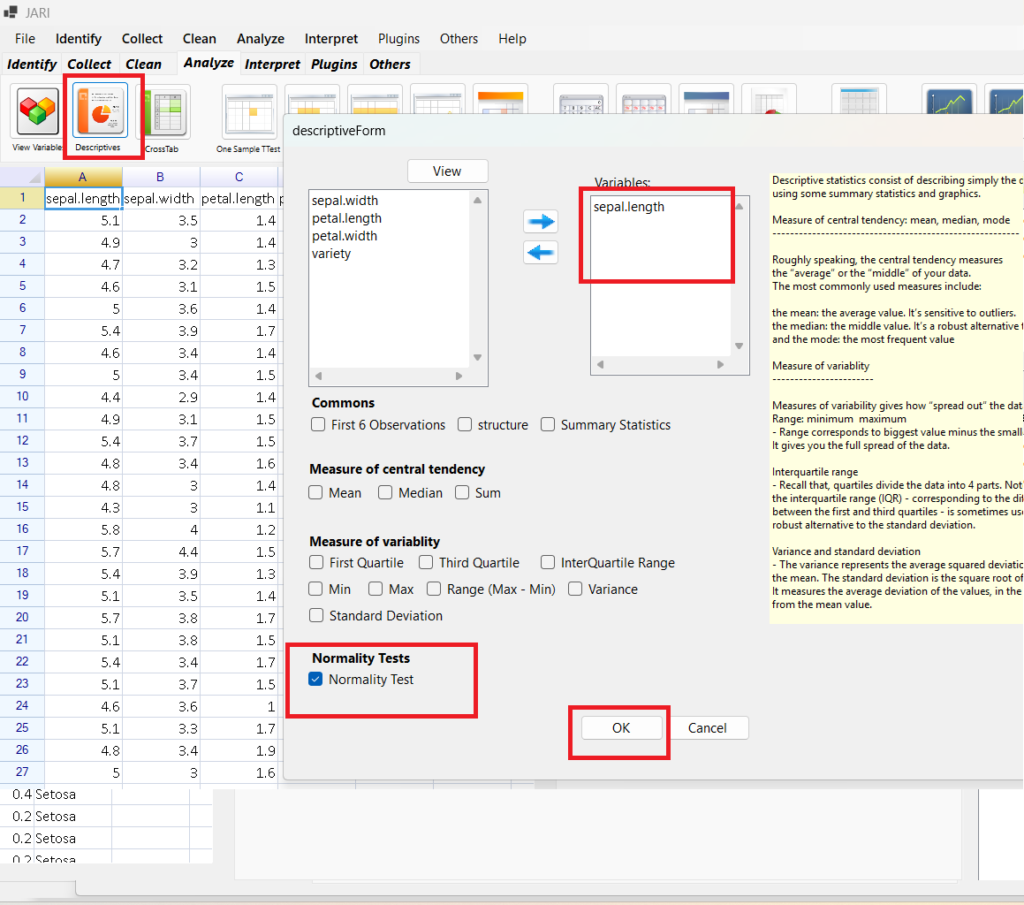
Save Results. Name NormalTestSepalLength. Save.
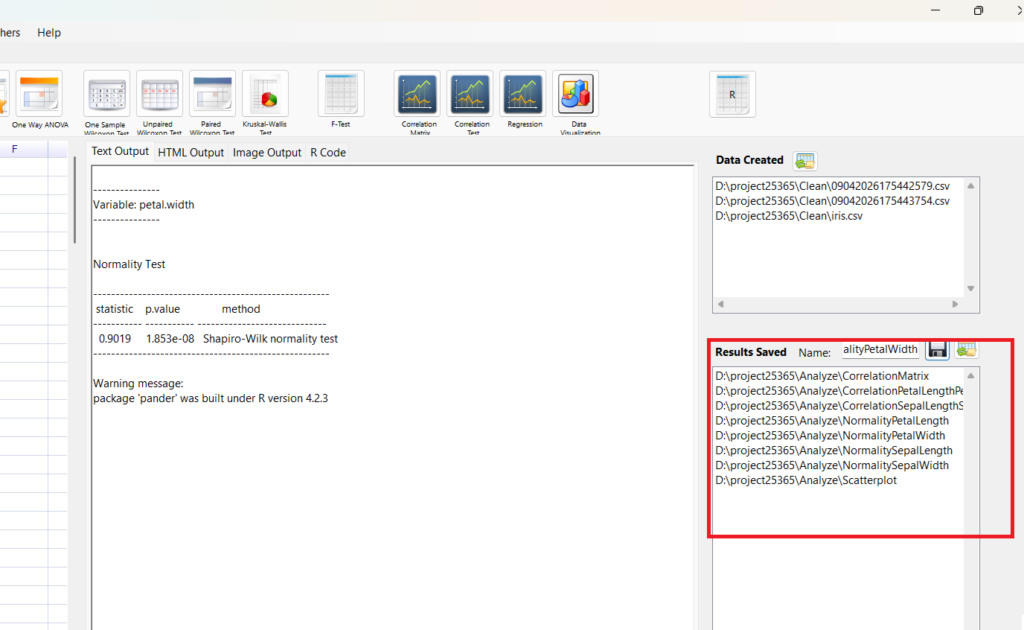
Repeat that for
- Petal Length
- Sepal Width
- Petal Width
- How are the variables correlated to each other?
- What is the distribution of each variable?
- How are the variables same to each other in mean or median?
So, How are the variables same to each other in mean or median?
Since the variable are not normal distribution, Click Unpaired Wilcoxon Test
Select variables
Click OK
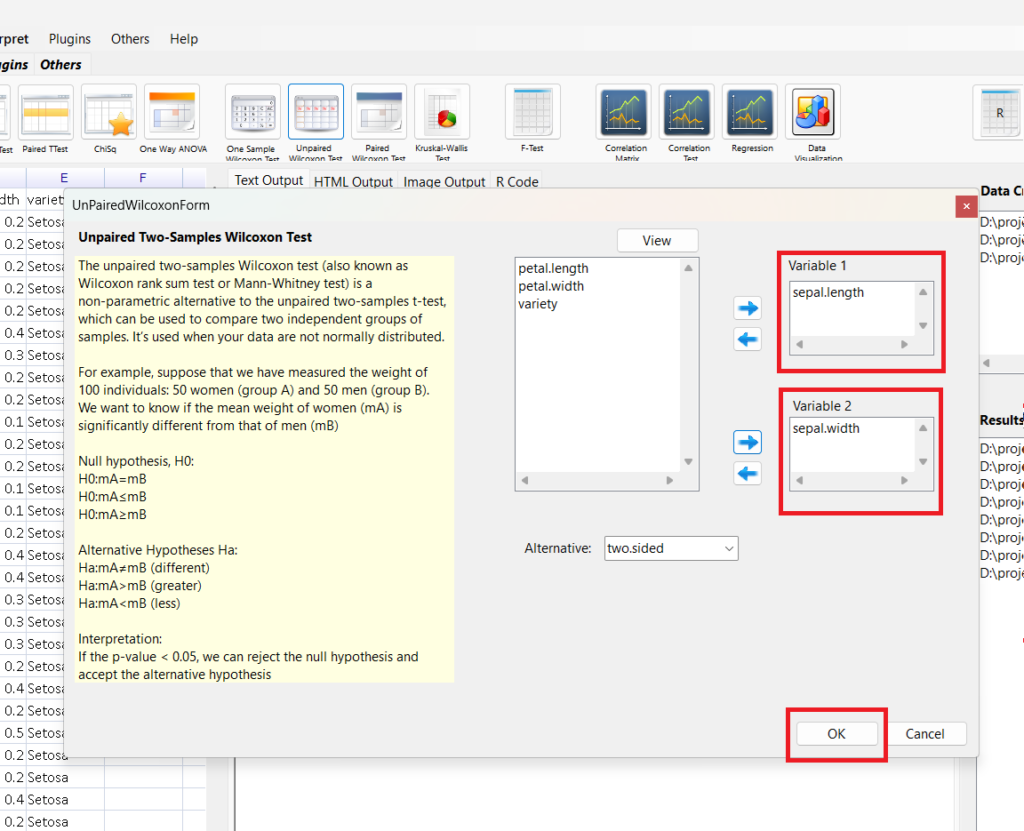
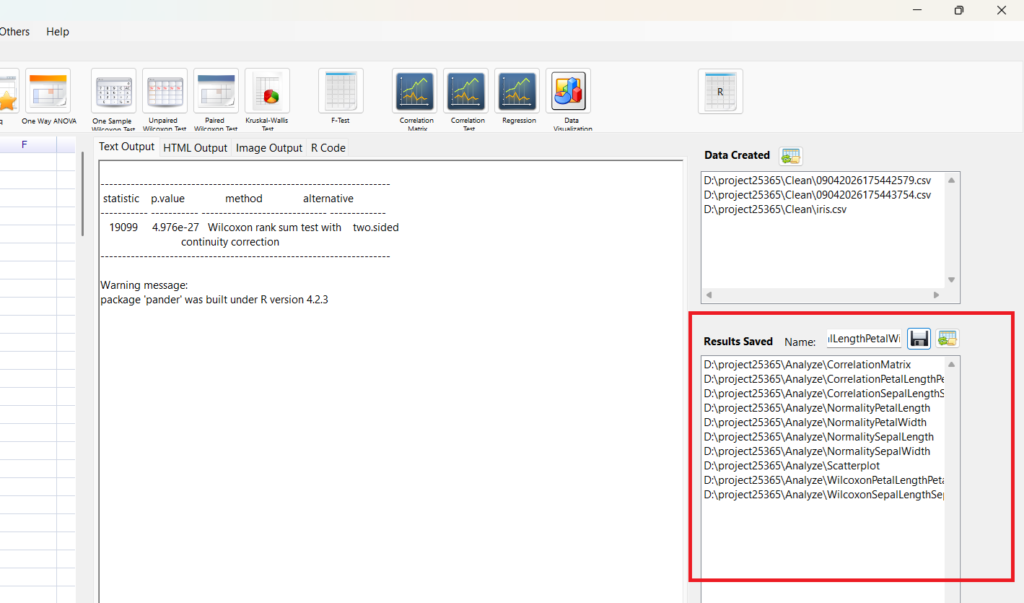
Save Results. Name WilcoxonSepalLengthSepalWidth Save
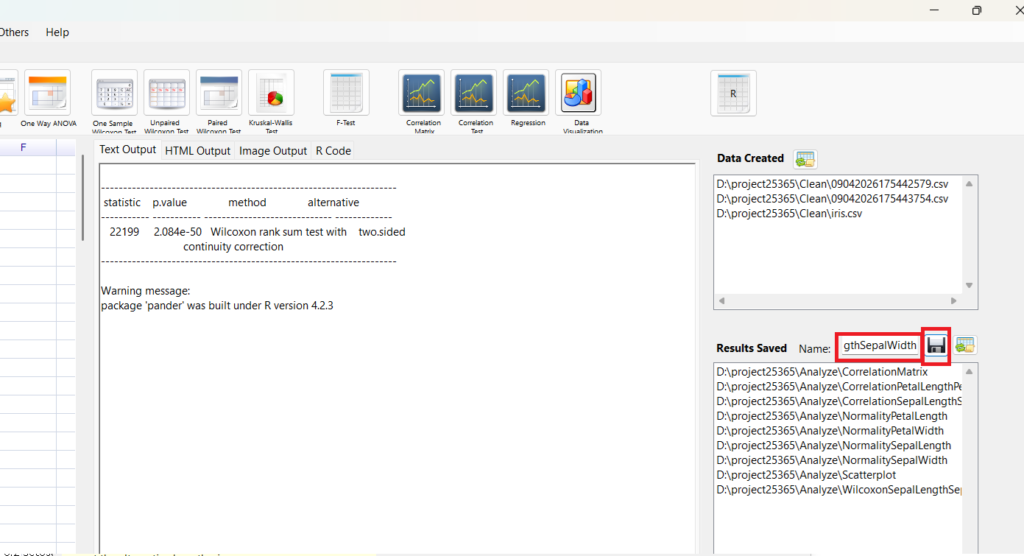
Repeat for Petal Length Petal Width
8. Intepret
Go to Intepret
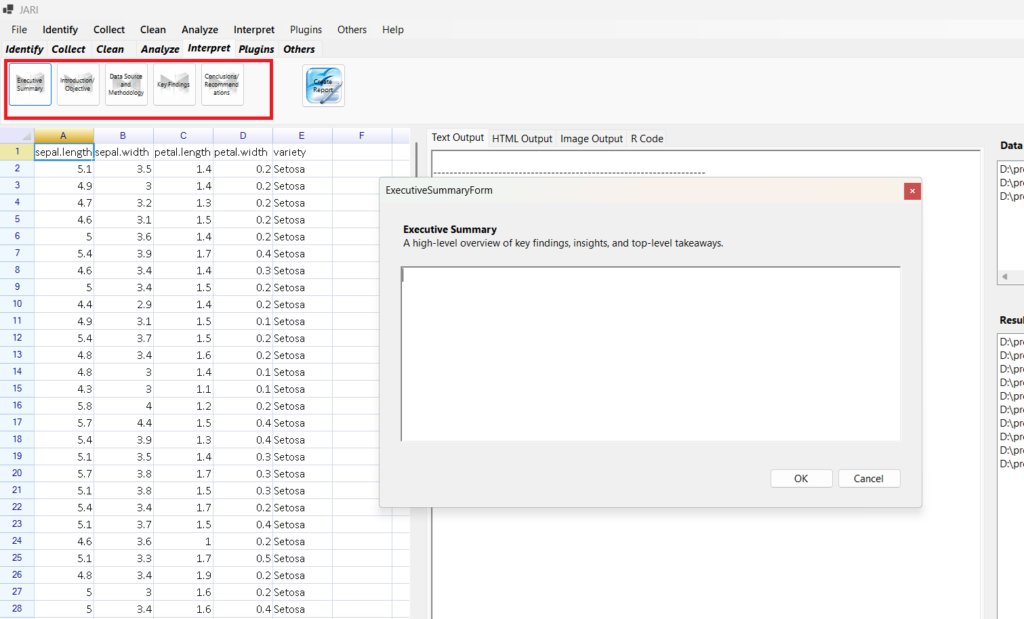
For now
Executive Summary:
JARI – Just Another R Interface, is a software developed by Eric Goh Ming HUi, author of the book – Learn R for Applied Statistics, published at Apress. This is a report generated ffrom JARI, for testing. You can download JARI at EGMHacademy.com. Executive Summary: Our company recently measured the iris flower and get the iris dataset.We would like to get some plots and exploration on the dataset. The company has three questions – how are the variables correlated to each other, what is the distribution of each variable, and how are the variables same to each other in mean or median. We will use the correlation matrix for the first question, the normality test for the second question, and Wilcoxon test for third questions.
Introduction
Our company recently measured the iris flower and get the iris dataset.We would like to get some plots and exploration on the dataset.
Data Source
Our company recently measured the iris flower and get the iris dataset.We would like to get some plots and exploration on the dataset.
Key Findings
- How are the variables correlated to each other?
- What is the distribution of each variable?
- How are the variables same to each other in mean or median?
Conclusion
We can infer that there is correlation between Petal Length and Petal Width, Sepal Length and Petal Length, Petal Width and Sepal Width. For Normality Test, Only Sepal Width is normal distribution. Both wilcoxon test showed P-Value < 0.05, hence, we can reject null hypothesis and the median of variable A is different of median of variable B. So, median of Petal Length and median of Petal Width is different. So, median of Sepal Length and median of Sepal Width is different
CLick Report
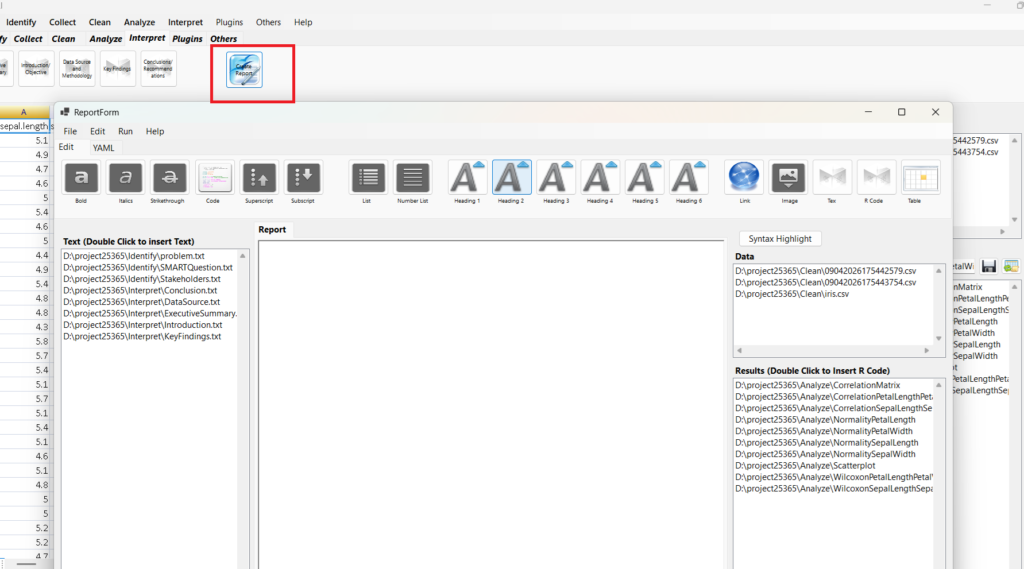
Click Heading 3 to insert ### text
Double Click Executive Summary to insert the summary
Change ### text to ### Executive Summary
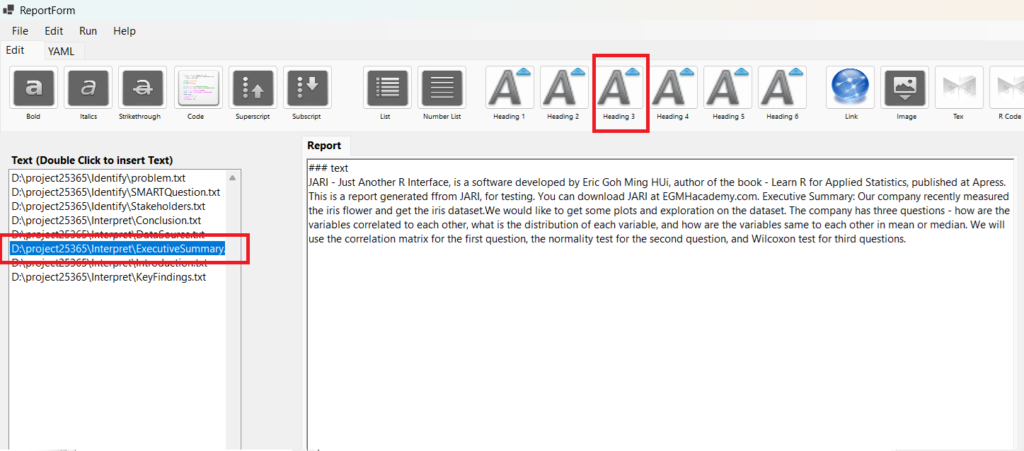
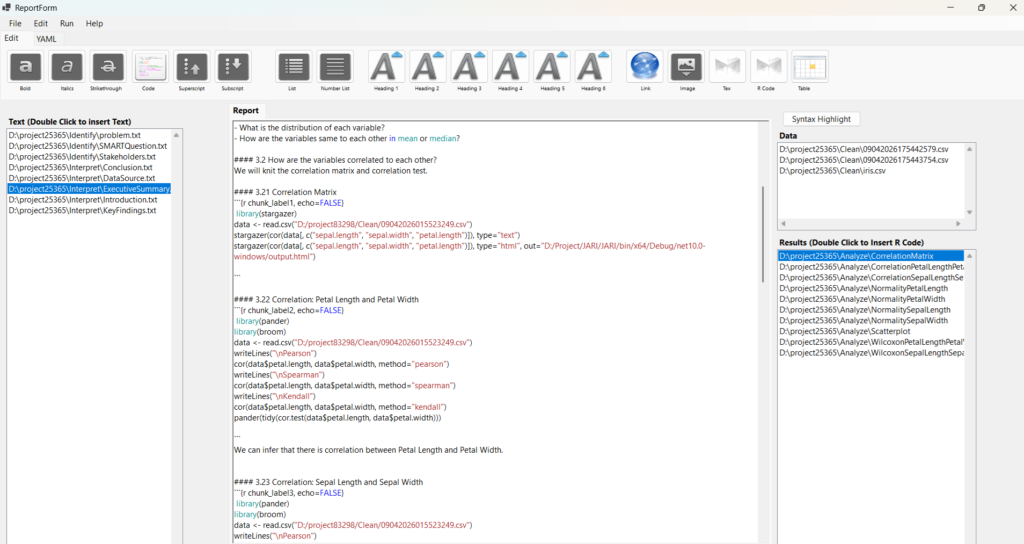
Double CLick CorrelationMatrix to put or add CorrelationMatrix R codes
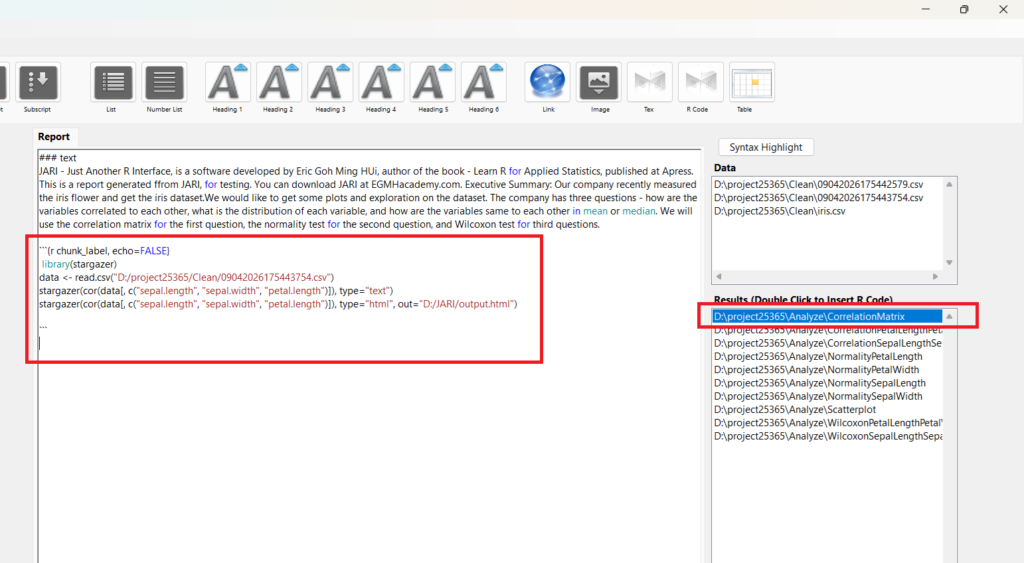
Edit your rmarkdown and report to what you….
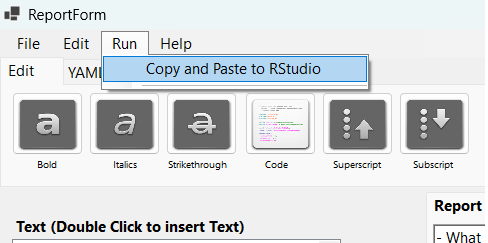
I have problem to install knitr for R Portable 4.2. Hence, I cannot run the rmarkdown. For now, click on Run > Copy and Paste to RStudio
You need to install latest R and RStudio. You also need to install pander and broom packages.
In RStudio
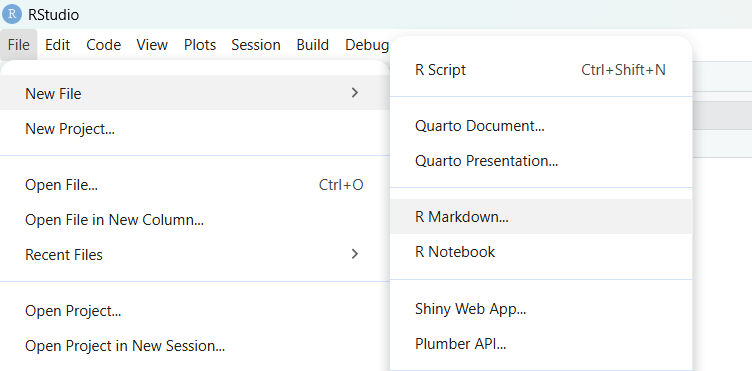
File > New File > R Markdown
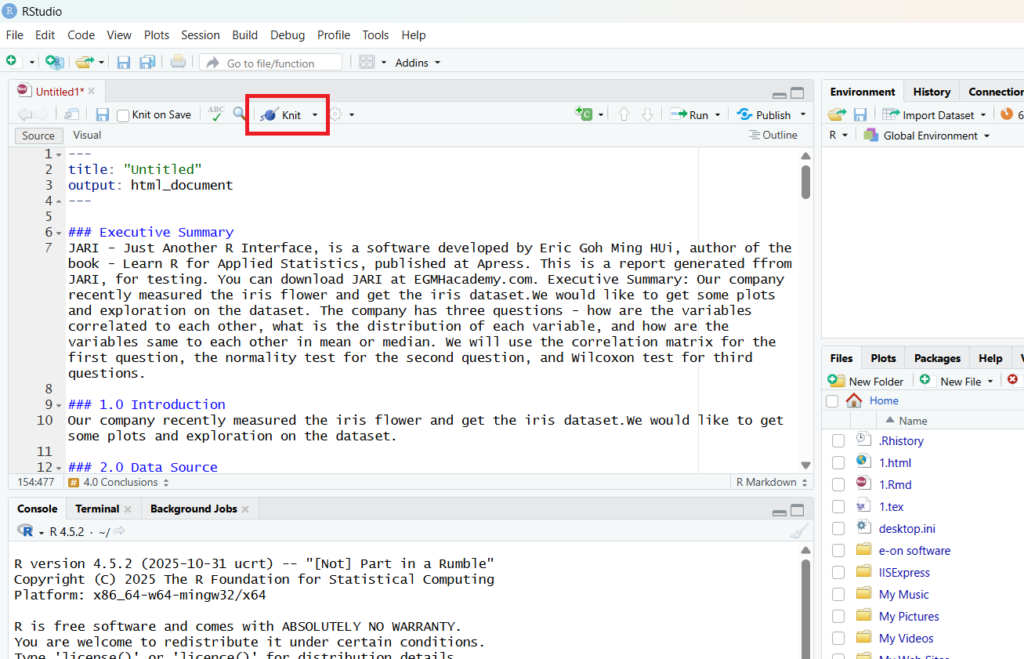
Paste into RStudio and click knitr
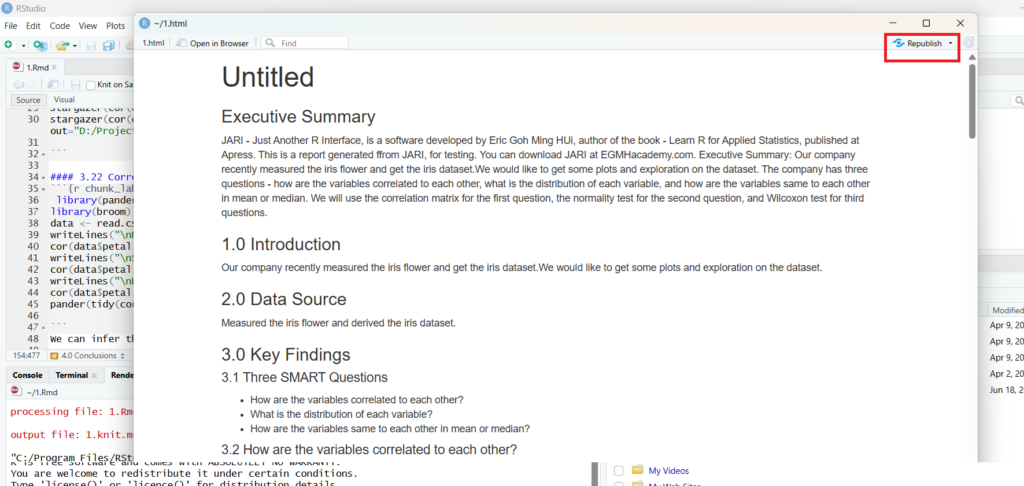
You can click on the publish Button

RPubs – Testing use of JARI – Just Another R Interface to generate Report