A fresh way to do Data Analysis and Data Mining

JARI – Just Another R Interface
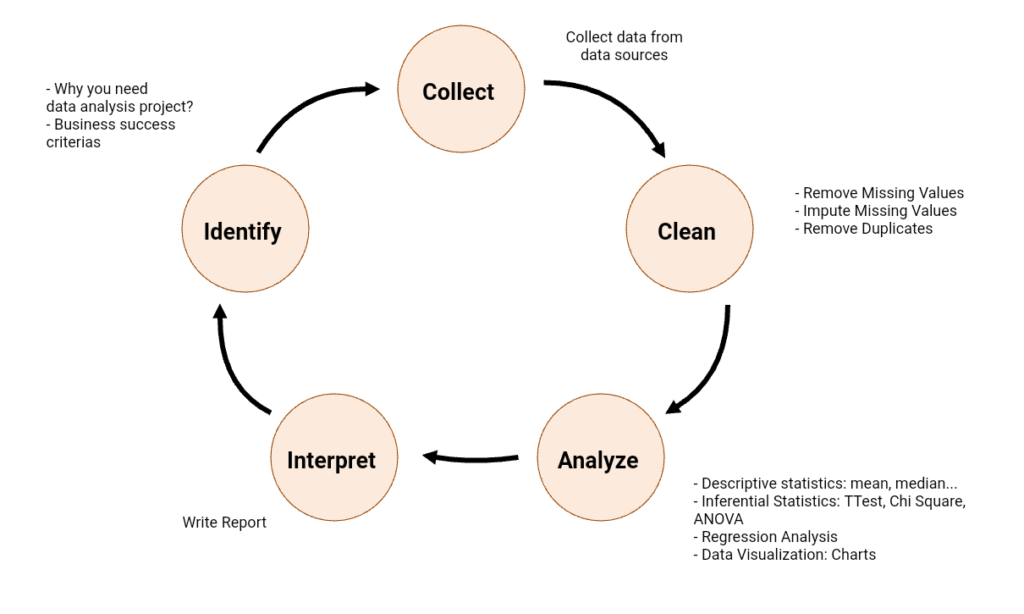
JARI – Just Another R Interface, is a software that provides a suite of tools for Data Analysis. It follows closely to the data analysis process – Identify, Collect, Clean, Analyse, and Interpret. For the Identify stage, JARI will guide you through identifying problems, SMART Questions, and Stakeholders. At the Collect stage, JARI allows you to use Image to Data, Video to Data, MySQL to Data, Webscraping softwares, and combine data using Gnumeric. JARI provides a set of analysis tools for the Analyse stage – Descriptive statistics (Mean, Median, …), Inferential Statistics( T.Tests, ANOVA, non-parametic Tests), Correlation Analysis, and Regression Analysis. For the Interpret Stage, JARI allows you to put in saved results and write rmarkdown report and slides for Rpubs.
A Fresh Way to do Data Analysis and Data Mining Project

FREE
JARI is an open source software created by Eric M. H. Goh, publisher of the book Learn R for Applied Statistics at Apress.

FRIENDLY
JARI has an intuitive interface that was designed with users in mind. There are descriptions on each Statistics part to help you in your data analysis.

FOR NON PROGRAMMER
JARI can generate R codes with a few clicks, but also allows writing of R codes. Advanced R programmers and non-programmers can both use JARI for their data analysis projects.
Data Analysis Process
MAIN FEATURES
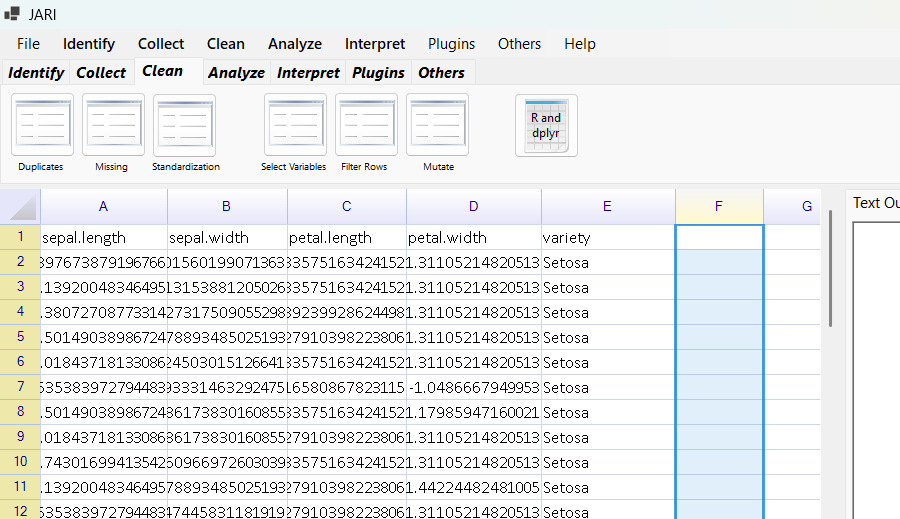
Clean Stage
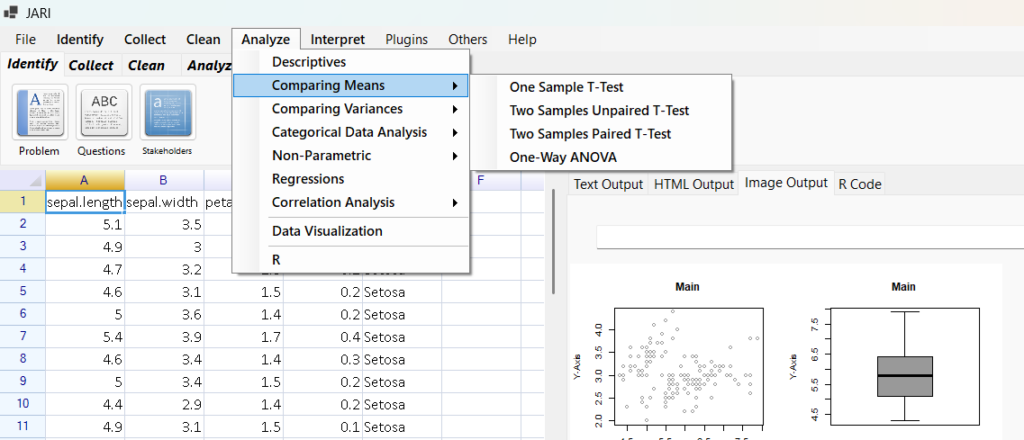
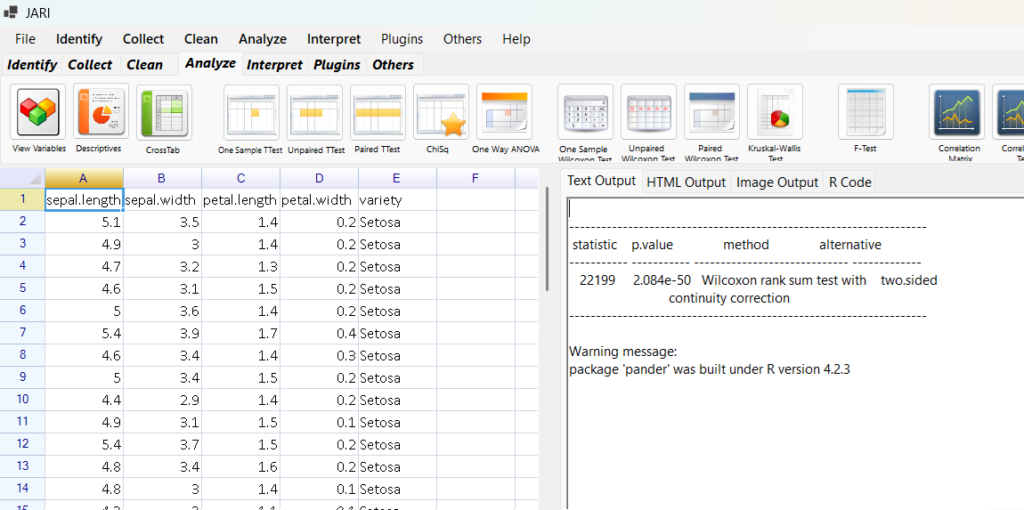
Analyze Stage

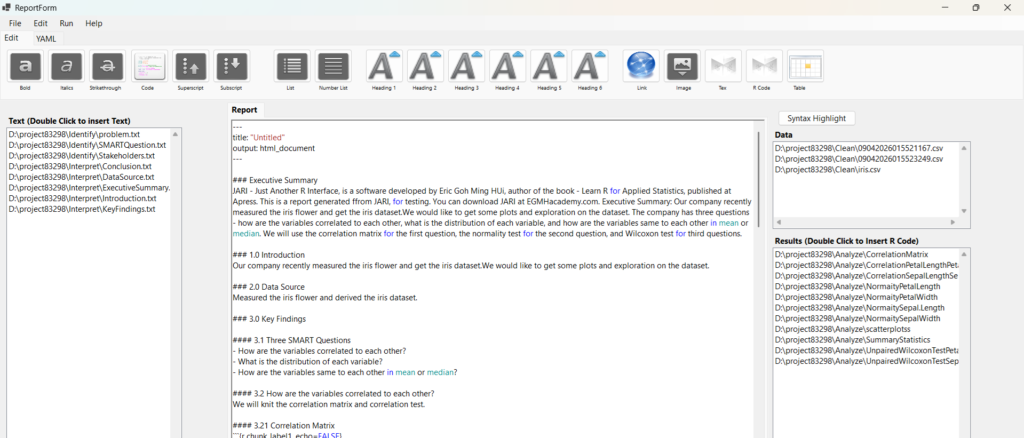
Interpret
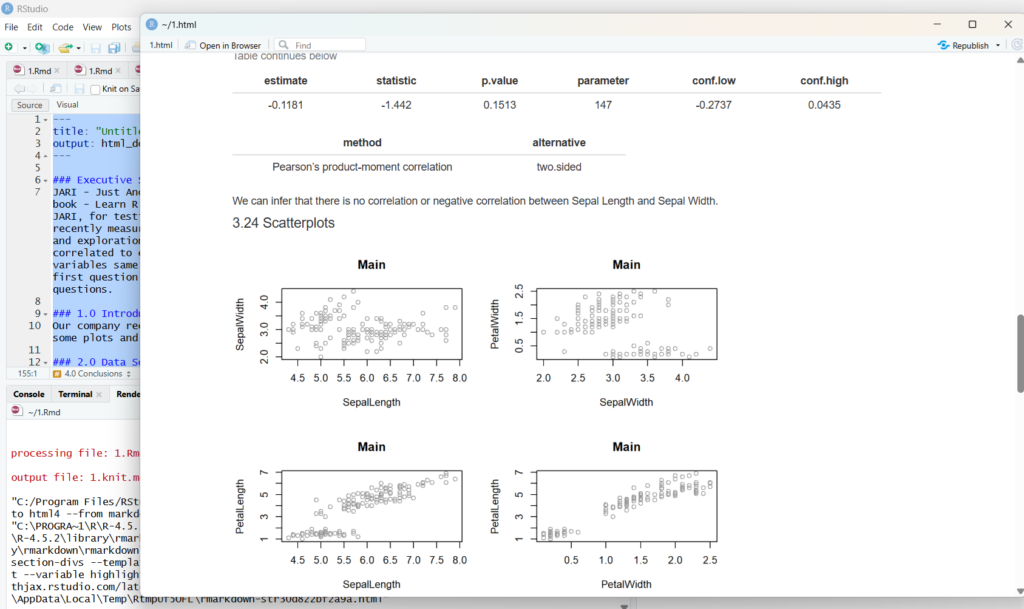
R Code
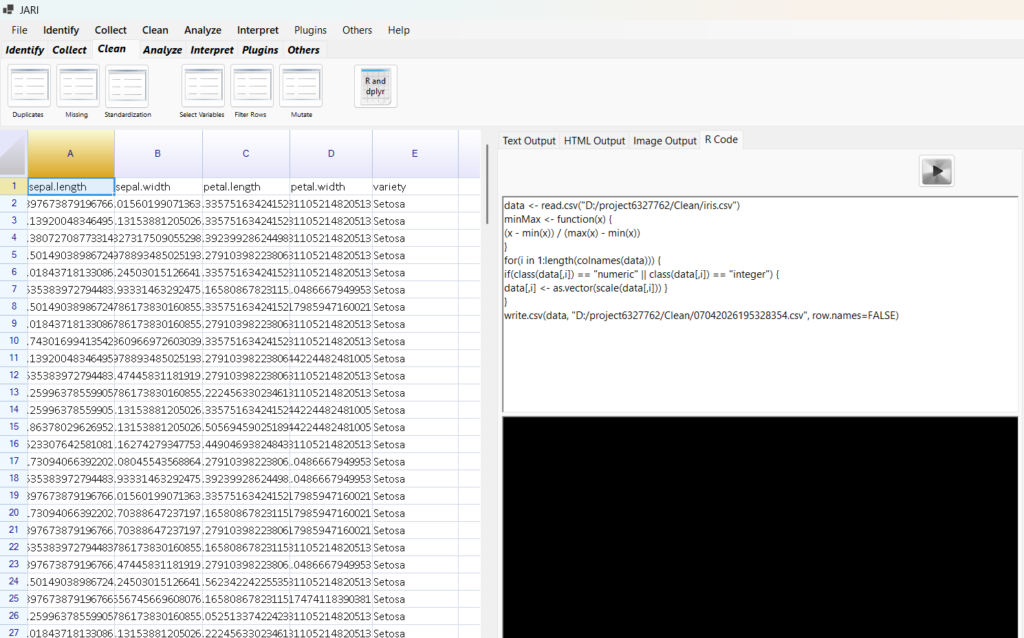

User-friendly Interface
- Spreadsheet layout
- Easy to use Interface
- Generate R Codes in few Clicks

Follow Closely to Data Analysis Process
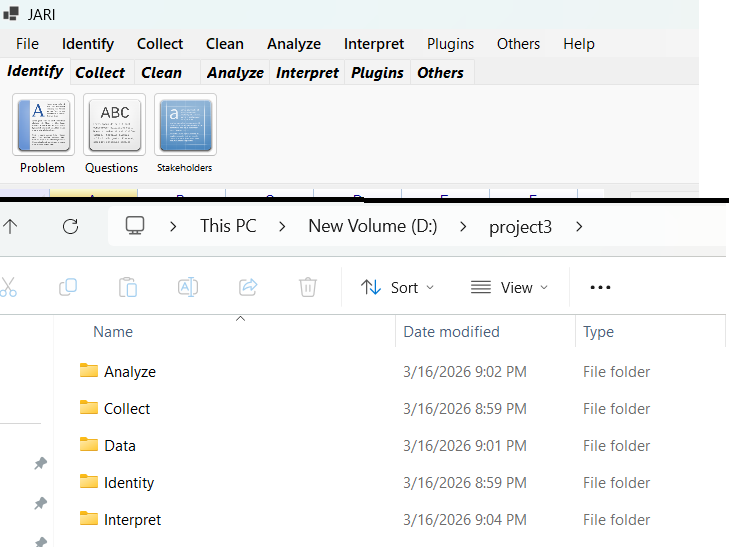
Unlike normal data analysis software like JASP and jamovi, JARI follows the data analysis process. See image on the left, JARI has a tabbed interface that follow data analysis process. The project you created also consist the folders – Identify, Collect, Clean, Analyze, Interpret. You should be spending time in these folders when doing data analysis projects.

Many Features
Identify Stage: Guide you to write Problem, SMART Questions, and Stakeholders…
Collect Stage: Provides Video to Data, … softwares
Clean Stage: Provides remove duplicates, remove missing values, Standardization, Sleect Variables, Filter Rows, Create Variables…
Analyze Stage: Provides Descriptive Statistics (mean, median, …), Inferential Statistics (One Sample T.Test, Two Samples Unpaired T.Test, Two Samples T.Test, ChiSq, One Way ANOVA, Non-Parametric Tests), Correlation Analysis, Regression Analysis, and Data Visualization
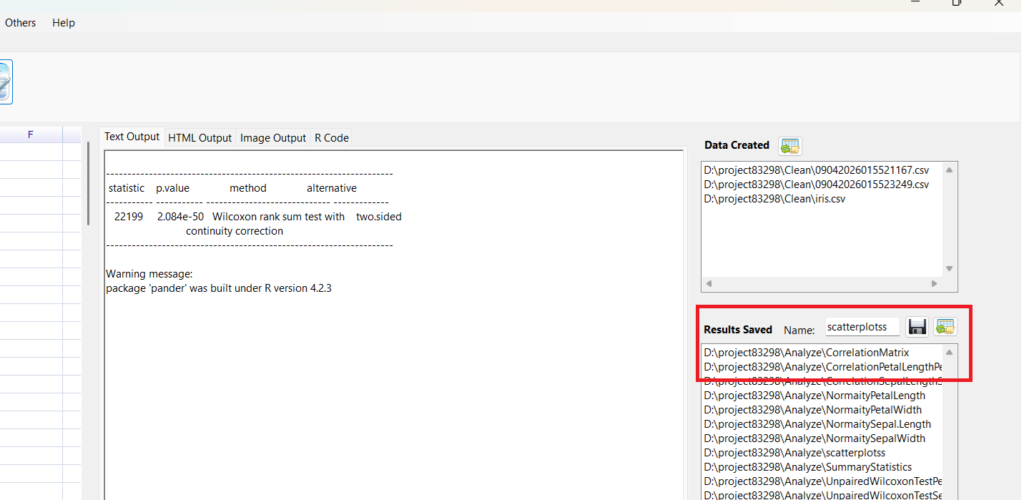
Interpret Stage: JARI allows you to put in saved results and write rmarkdown report and slides for rpubs.
Write R Codes: Love R? JARI allows writing of R codes. Advanced R programmers can both use JARI for their data analysis projects.
Your First Step in using JARI
Eric Goh Ming Hui
Founder
Eric Goh is the author of the book “Learn R for Applied Statistics” published at Apress. He founded EGMHAcademy.com. He developed JARI.
Eric Goh holds a Master of Technology in Knowledge Engineering from the National University of Singapore, an Executive Master of Business Administration from U21Global and IGNOU, and Graduate Diploma in Mechatronics from A*STAR SIMTech.